SQL Server Execution Plan
- Maria Elena Morillo Tejada
- Jun 17, 2022
- 4 min read

Updated: Jun 21, 2022

SQL server execution plan is a tool that offer SQL management studio that give to the user the explanation of each part of a query while this is running, with the objective to generate the most efficient and low cost query plan.
There are two different way use for SQL management studio do this work: Estimated execute plan and actual execution plan. Execution plan are store in memory called plan cache. There are three different formats of execution plans available in SQL Server - Graphical plans, Text plans, and XML plans. To execute this tools you have to have a user with 'SHOWPLAN' permission.
Estimated execution plan: this type of plan is generated after the execution of the query or after compilation. It will show you an estimated in terms about how much your query use of memory, processor, CPU, etc., during the query execution.
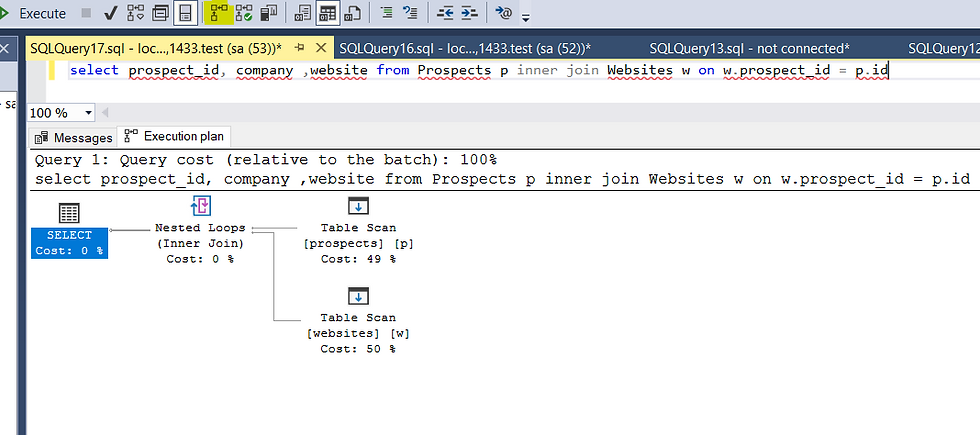
This type is activated after the execution of the query, pressing the marked with yellow color icon showed on the image. To generate the estimated execution plan you can use the shortcut 'CLRT+L' or you can do right-click on the query window and select “Display Estimated Execution Plan” from the context menu that appears
Also you can see objects like Clustered index and Non-clustered index scan if the table have an index or table scan if the table doesn't have indexes.
Actual execution plan: This plan is used to troubleshoot the examine the performance during the query execution to improve and make a higher performance in your query. This has to be activated before the execution of your query. It is giving actual information by the query processor and provides all information like which are the steps involved when we execute that query.

To include the actual execution plan you can use the shortcut 'CLRT+M' or you can do right-click on the query window and select “Display Actual Execution Plan” from the context menu that appears.
When we executed the query, we can see three different tabs available: Results, Messages and Execution plan. Another difference is that it will show you the time taken for the scan. There are 3 parts in which we can divide our execution plan.
Select
Nested Loops
Table Scan
Components in an Execution plan
If you can see the table haven't large number of data, indexes, constraints, etc. But, if you make an execution plan with another table with the characteristics mentioned before you can have different results depending of your table structure and data.
The execution plan shows different things that we have to know :

Physical operation: object or routine that performs an operation. For example, some physical operators access columns or rows from a table, index or view. Others are calculations, aggregations, data integrity checks or joins.
Logical Operation: describe what operation to be performed, in this case the 'Inner join'.
Actual Execution mode: This is the actual execution mode that is used by the processing engine to execute the query. It can be Row or Batch.
Estimated execution plan: It is similar to actual execution mode but this hows the values.
Actual number of rows for all executions: returns the total number of rows read by the operator.
Actual number of batches: shows the number of batches being executed to fetch the results in the case that the execution mode is in Batch.
Estimated operator cost: relative information with respect to the other operators in the execution plan.
Estimated I/O cost: the cost of input/output operations of the result set.
Estimated CPU cost: the cost of CPU will incur in order to execute the operation.
Estimated subtree cost: The cost of the execution tree that is being currently read from right-to-left and top-to-bottom.
Number of executions: number of execution that the optimizer can manage in a batch.
Estimated number of executions: The number of rows that the optimizer will be returned by the operator.
Estimated number of rows for all executions: The number of rows that the optimizer thinks will be read by the operator.
Estimated row size: The storage size of each row in the operator.
Actual rebinds: how many times the reevaluation of the object must be done in order to process the operator.
Actual rewinds: that tell you if there were any changes in the correlated values for the object that is being processed.
Node Id: It is the automatic assignment of a number in the order in which the operator is called in the execution plan reading from right-to-left and top-to-bottom
Also, we have:
Predicate: This is the value retrieved from the WHERE clause in the SQL statement
Object: The table used
Output: The selected columns are being displayed in the result set
Live Execution Plan. The live execution plan bring you the option to see the execution of a query in real time or in an active execution of a query. It is provides real insights into the query execution process. The live query plan show the query progress and operator level run-time execution statistics like the numbers of rows produced, elapsed time, operator progress, etc. This type of execution statistics are extremely useful for debugging query performance issues. This feature is available starting with SQL Server 2016 (13.x) Management Studio, however it can work with SQL Server 2014 (12.x).
To include the Live Execution Plan you select the icon marked with yellow or Right click and select “Display Live Execution Plan” from the context menu that appears.

The result of an execution plan have to be read from the right side to the left bottom to up. The execution plan is a powerful troubleshooting tool to analyze the health of your queries. This tools help you when you are having slow queries. It is very important that a database professional have knowledge on how to use and take the best part of this tools to improve in the performance of a query.


Comments